The following reports are meant only for teachers.
Attendance Summary
Includes a table with one row per student. The first three columns give the
total number of class periods coveredbyt he report, the number of
ansences, and the number of times late. Each additional column
gives the attendance for a particular class.
An A in a column indicates absent. Otherwise the entry indicates
the number of minutes late. If the log files does not contain information
about the start time of the course, then number of minutes late is 0
for any student that has signed in during the class period.
Participation Summary
Generates a participation summary for all log files selected.
The summary begins with a header indicating the total number
of classes and the total number of questions asked.
This header is followed by
an overall participation table suitable for importing into a gradebook.
Each row corresponds to a student.
The first column contains the student name,
the second column contains the total number of questions
that student answered,
and the third column contains the total number of questions asked.
The table can also show the aveage grade of the student
and the number of reviews done by the student.
Single Log Summary
This report summarizes a particular class period. It contains the
following parts:
Query Report
- Attendance Summary
This contains a list of students in the class indicating for each student whether that student was absent, and if not, the number of minutes late. - Query Summary
For each question, the question is given follwed by a list of the student answers with an option to include the reviews given for each answer. - Shares Summary
With the appropriate option, all of the submitted shares are shown. - Message Summary
With the appropriate option, all of the messages sent to the students are shown. Replys to these messages are also shown.
This report lists all of the queries for a particular class period.
Report Report
This report summarizes what reports were generated and lists any
error messages that were produced.
The following reports are meant for students and teachers. For each report type, an indiviudal report is generated for each student. A single report containing information on all students is generated for the teacher.
Student Attendance
Summarizes the attendance for a single student for the specified logs.
The summary begins with a summary of the number of days attended
and the number of questions answered. This is followed by a list of the
class peroids and the attendance for that class peroid. Attendance information
includes whether the student was absent, on time, or the number of minutes late.
Student Participation
This report is similar to the attendance report but gives
additional information including the
total number of points, the average number of porints,
and the number of reviews done.
Student Report
The report gives complete information about the results
a colletion of class peroids for a given student.
For each class peroid, the report can contain the following information
depending on the options selected:
Messages sent to the sutdent and any replies,
answers to each query,
reviews done by the student,
reviews of the student answers, and
shares submitted by the student.
Report Options
Reports have three types of options: generation options, save options, and distribtuion options. The generation options determine the contents of the report. The save options determine the format in which the reports are saved in files. The distribution options allow the reports to be sent as email and determine the recipients of the report as well as the format (text or html, inline or attachment).Generation Options
Generation options determine the content of the reports. Some report types can generate a separate report for each student (e.g. the Individual Participation Report) or a single compendium report containing information from all of the separate reports. Similarly, some report types can generate a separate report for each class period (e.g. the Single Log Summary) or a single compendium report for all class periods. Other report types can only generate a single report (e.g. the Attendance Summary). Other generation options determine the order of the output and what specific information is included in the report (e.g. whether or not to include grades). Lastly, some reports provide for the generation of a Private Compendium Report, which does not include student names.
The table below gives a list of the generation options that are appropriate for each type of report.
| Name | Report Option | Description |
| Attendance Summary | Reverse Order | The Reverse Order option, if selected, causes the dates to be listed in reverse chronological order. |
| Participation Summary |
Order by Points Show Grades Show Reviews | If the Order by Points option is chosen, the table is sorted with the students with the highest average first. Otherwise the table is sorted by the name of the student. If Show Grades is selected, one column of the table gives the average grade of the student. If Show Reviews is selected, the table includes a column containing the number of reviews done by this student. |
| Single Log Summary |
Individual Report Compendium Report Private Compendium Report Reverse Order Show Grades Show Reviews Show Shares Show Messages |
If Individual Report is selected, a separate file is created
for each student.
If Compendium Report is selected a single log file is created that
contains the individual logs for each student.
If Private Compendium Report is chosen, a compendium log is
created that replaces all student names with dummy names to make
the information anonymous.
If none of these is selected, no logs are created.
The Reverse Order option, if selected, causes the logs to be listed in reverse chronological order. By default, grades, reviews, shares, and messages are included in the logs, but these can be omitted by deselecting the corresponding option. |
| Query Report |
Individual Report Compendium Report Reverse Order |
If Individual Report is selected, a separate file is created
for each class period.
If Compendium Report is selected a single report is created that
contains the individual reports for each class period.
If neither is selected, to report is generated.
The Reverse Order option, if selected, causes the classes in the compendium report to be listed in reverse chronological order. |
| Report Report | There are no options for this report. | |
| Student Attendance | Individual Report Compendium Report Reverse Order |
If Individual Report is selected,
a separate file is created for
each student.
If Compendium Report is selected a log file is created that
contains the individual logs for each student separated by form feeds.
If neither is selected, not logs are generated.
The Reverse Order option, if selected, causes the dates to be listed in reverse chronological order. |
| Student Participation | Individual Report Compendium Report Private Compendium Report Reverse Order Show Grades Show Reviews |
If Individual Report is selected,
a separate file is created for
each student.
If Compendium Report is selected a log file is created that
contains the individual logs for each student separated by form feeds.
If Private Compendium Report is chosen,
a compendium log is created
that replaces all student names with dummy names to make the information
anonymous. If none of these is selected, no reports are created.
The Reverse Order option, if selected, causes the classes to be listed in reverse chronological order. By default, grades and reviews are included in the logs, but these can be omitted by deselecting the corresponding option. |
| Student Report | Individual Report Compendium Report Private Compendium Report Reverse Order Show Grades Show Reviews Show Shares Show Messages |
If Individual Report is selected, a separate file is created
for each student.
If Compendium Report is selected a log file is created that
contains the individual logs for each student separated by form feeds.
If Private Compendium Report is chosen, a compendium log is
created that replaces all student names with dummy names to make
the information anonymous.
If none of these is selected, no logs are created.
The Reverse Order option, if selected, causes the class perioids to be listed in reverse chronological order. By default, grades, reviews, shares, and messages are included in the reports, but these can be omitted by deselecting the corresponding option. |
Save Options
Reports can be saved in text or HTML format. The Attendance Summary and Participation Summary reports can also be saved as a comma separated list (CSV) so that they can easily be imported into a spreadsheet.
Distribution Options
Distribution Options determine the whether or not reports are sent by email and if they can specify the recipients. They also determine whether the format of the body of the email (text, HTML, CSV, no body) and whether the reports are sent as attachments. Attachments can be in text and/or HTML and can also be in CSV format if appropriate for they report type. Three of the report types can be sent to students in the class, and if so, the distribution options determine whether emails are sent to students.
Some combinations of options are not compatible. For example, only individual reports can be sent to students, each getting that students individual report. If an individual report is not generated, nothing can be sent to students. The Report Generator does not allow you to select incompatible options. If a configuration file for the Report Creator contains incompatible options, these options will be ignored. For example, if you request a CSV report for a Single Log Summary, that request will be ignored. Similarly, if you request to sent an Attendance Summary to students, that request will be ignored. Only the Student Attendance, Student Participation, and Student Reports can be sent to students.
The following is a list of the distribution options:
- Distribute
There is an overall Distribute option that must be set in order for emails to be sent. Configuration for each report type also has a Distribute option. Both of these must be set in order for emails to be distributed. - Sender
An email must have a sender. The sender is normally specified in the server configuration but can be overridden using either the Report Creator or the Report Generator. - Body
This destermines the type of body of the email. Since an email has only one body it must be set to one of none, text, HTML, or CSV. If the body type is set to none, no emails will be sent unless an attachment is sent. - Attachment
This can be set to any combination of text, HTML, or CSV, including none of these. If CSV is chosen for a report type other than Attendance Summary or Participation Summary, it is ignored. - Send To Students
If this option is set and the report is appropriate for students each student will be sent and email with a report containing information about that student. Only the Student Attendance, Student Participation and Student Report can be sent to students and this options is ignored for other types of reports. - Send To Others
If this option is set, the report will be sent to those in the Send To Others List. - Add To Others
This option takes a single email address as a parameters and adds that email address to the Send To Others List. This list is ignored unless the Send to Others option has been set. - Blind Send To Others
If this option is set, the report will be sent to those in the Blind Send To Others List as a blind copy. Others receiving the email will not see this list. - Add To Blind
This option takes a single email address as a parameters and adds that email address to the Blind Send To Others List. This list is ignored unless the Blind Send to Others option has been set.
Processed and Unprocessed Logs
Reports are created from log files that are generated doring a class session. ClassQue has a way to distinguish between log files that have already been used to generate reports and those that have not. Log files that are stored in a subdirectory named processed are considered processed logs and those in any other directory are considered unprocessed. In the standard way of setting up ClassQue, generated logs are stored in a logs directory and this directory has a processed subdirectory for holding logs that have already been processed.The master server can move set a log as either processed or unprocessed by moving it between these directories. The ClassQue Report Creator which can be used to create reports automatically can be set to only look at processed or unprocessed logs and can move logs into the processed state after reports have been created. The ClassQue Report Generator (described below) can distinuish between processed and unprocessed logs and can move logs in and out of the processed state.
Using the Report Generator
The report generator can be used without any prior configuration, or it can be configured to set the iniial value of three parameters, the name of the host running the master server, the port number for the master server, and a password. When the Report Generator starts, an initial window appears similar to that of Figure 1.
Figure 1: The initial Report Generator window.
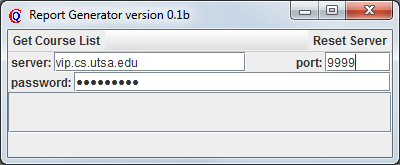
If not already configured, fill in the fields for the server, port, and password. Two menu items are availble at the top of the window. Get Course List retrieves a list of courses frm the master server that are accessible with the password entered. The master server has a password that grants access to all courses. Otherwise, courses whose teacher password matches the one entered are accessible. The menu item Reset Server requests that the server reread all log file in case any have changed since the last reset.
Figure 2 shows an example window that appears after the Get Course List menu item is selected. It lists each available course. Pushing a Get List button will retrieve a list a all logs for that course.
Figure 2: A course list.
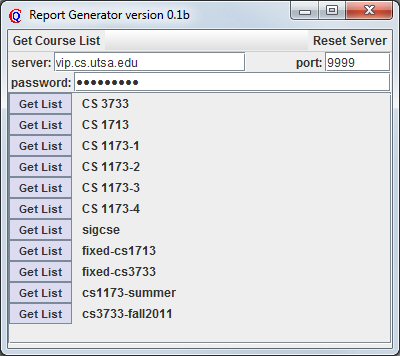
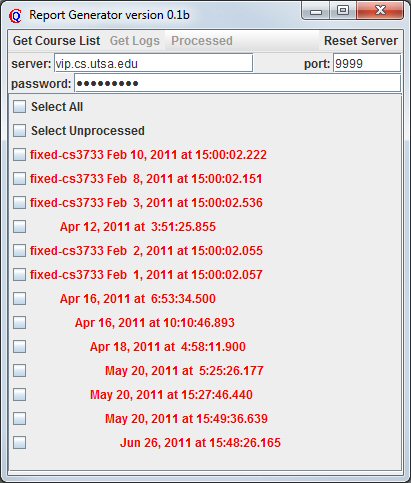
Figure 3 shows a list of logs available for the course fixed-cs3733. It is similar the the Resume from Server list. Unprocessed logs appear in red and processed ones appear in black. You can select any collection of logs and push Get Logs to prepare for generating reports for the corresponding classes. Another option is to push the Processed menu item which moves selected logs to and from the processed state.
Figure 3: A list of logs.
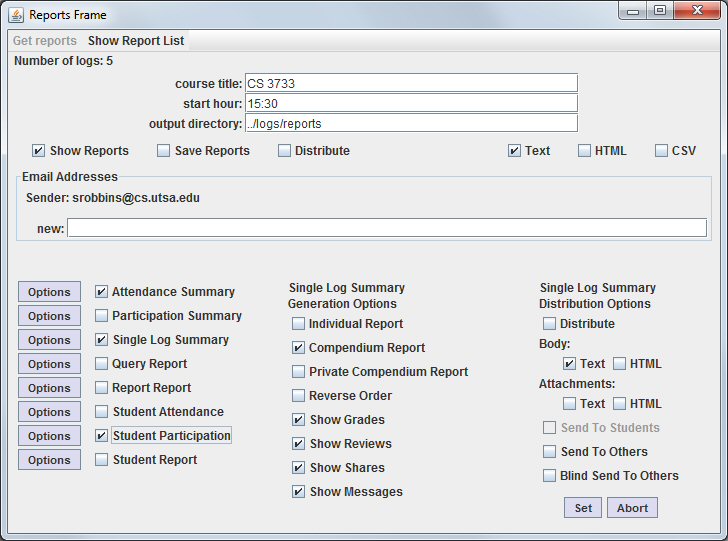
A discussion of the naming convention for the log files can be found here. Figure 4 shows the Reports Frame generated after all of the logs from Figure three have been selected and the Get Logs menu item has been selected. It shows that 5 log file have been received and the course title, start hour, output directory, and sender (for emails) has been filled in from the log files. You can override the course titel, start hour, or output directory by entering new values.
Figure 4: The Reports Frame.
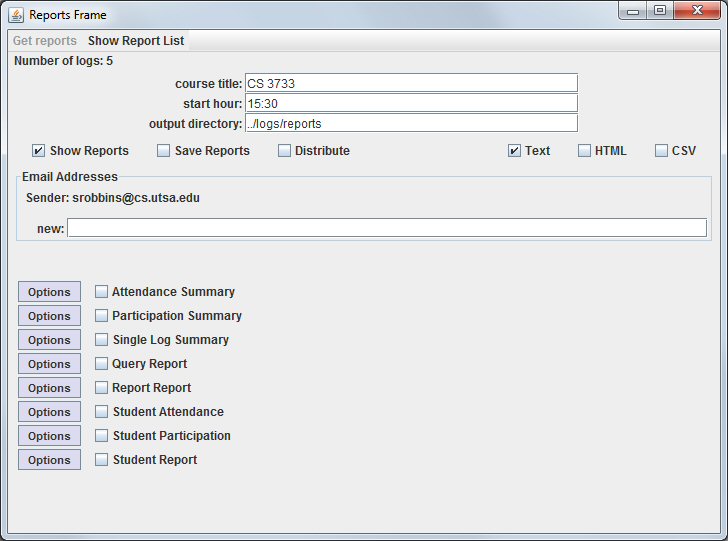
You can choose whether to save or show reports, and indicate the format for saved reports using the Text, HTML, and CSV checkboxes.
Each of the 8 report types is listed and you can check the ones you want to generate. Generate the reports by pushed the Get Reports menu item which will be avaliable once at least one report type has been selected. The Show Report List menu item will open a new frame with a list of reports already generated. Pushing one of the Options buttons shows the options for the corresponding report. An exmaple is shown in Figure 5. Once options are displayed, you must Set ot Abort these options before you will be allowed to generate any additional reports.
Figure 5: The Reports Frame with options selected.
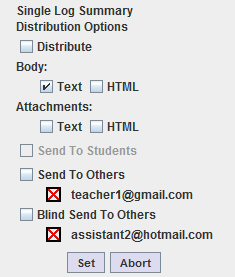
Setting email addresses
The Distirbution Options in Figure 5 has checkboxes for Send to Others and Blind Send To Others. Recipients do not see the email addresses from the Blind Send to Others list. Initially, both lists are empty. Figure 6 shows the Distribution Options with addresses added to these lists. Clicking on the
 will remove the entry. To add entries to these lists, first type an email
in the new field of the Email Addresses section of the Reports Frame
and push Enter. This inserts a new email address in the list.
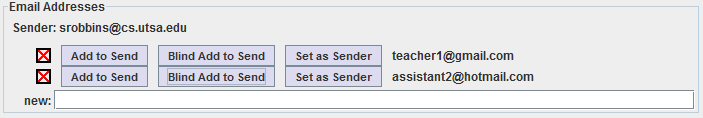
Figure 7 shows the Email Address section of the Reports Frame in which three
email addresses have been added. Each has a button to add this to the send
list, a button to add it to the blind send list, and a button set set this
email address as the sender of the email. These first two buttons are
only active when the Distribution Options of a report type are showing
and they affect only that report type.
will remove the entry. To add entries to these lists, first type an email
in the new field of the Email Addresses section of the Reports Frame
and push Enter. This inserts a new email address in the list.
Figure 7 shows the Email Address section of the Reports Frame in which three
email addresses have been added. Each has a button to add this to the send
list, a button to add it to the blind send list, and a button set set this
email address as the sender of the email. These first two buttons are
only active when the Distribution Options of a report type are showing
and they affect only that report type.
Figure 6: Distribution Options with
email addresses set.
email addresses set.
Figure 7: Email addresses section of the Reports Frame.
Sending email Reports
In order to send email reports, the main Distribute checkbox (under the Output Directory) must be checked and the individual report distribution option: Distribute must also be checked. In addition, email recipients must also be set.
The Report List Frame
Figure 8 shows a Report List Frame.
Figure 8: The Reports List Frame.
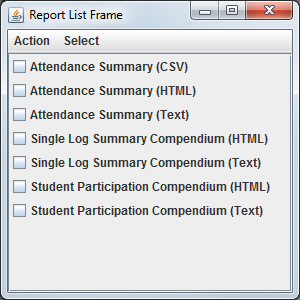
It lists all of the reports displayed and has two menu items, Action and Select. Action has three subitems:
Delete Selected:
Select also has three submenus: Select All, Select None,
and Select Students. The last of these selects only those reports
that are about individual students.
This deletes the selected reports. This only affects
what is displayed on the screen and does not delete any files.
Keep Only Selected
This deletes all but the selected reports.
Move Selected
This moves the selected reports next to the Report List Frame.
It is espscially useful when student reports are created and allows you to
easily find the report of a partictular student.
Return to the main ClassQue page
