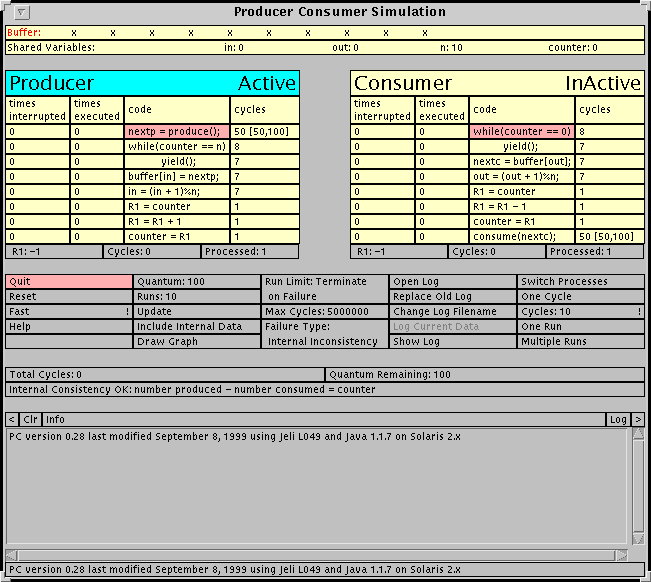
Figure 1: The main simulator window.
In the bounded buffer problem, two (or more) processes are sharing a bounded buffer with at least one process inserting items into the buffer and at least one process removing items from the buffer.
The buffer is a queue of size n which is implemented as a circular queue in an array. The variable in is the index of the next free slot while out is the index of the last full slot. The variable counter contains the number of filled slots.
The producer executes the following code in a loop:
      nextp = produce();
      while (counter == n)
           yield();
      buffer[in] = nextp;
      in = (in + 1) % n;
      counter++;
The consumer executes the following code in a loop:
      while (counter == 0)
           yield();
      nextc = buffer[out];
      out = (out + 1) % n;
      counter--;
      consume(nextc);
The yield() statement removes the process from the CPU and puts it in the ready queue. It is assumed that some type of round robin scheduling is done in which all other processes in the ready queue will execute before this process can get back to the CPU. In a more realistic simulation, this would be replaced by a wait for notification of some kind. Since we are analyzing a different section of the code, the simpler (and less efficient) yield() is sufficient for our purposes.
If there are only one producer and one consumer, the only critical sections are the statements counter++ and counter--. In a typical RISC-like implementation each of these would be implemented with three assembly language instructions consisting of a load, an arithmetic operation on a register, and a store. If either one of these is interrupted and the other process gets the CPU and modifies the counter, the result may be a counter value which is not correct. The result could be an item which is never processed, an item processed twice, or a reference to an uninitialized variable is made.
The purpose of this simulator is to explore the likelihood of interrupting a critical section and what happens when such an interrupt occurs.
System requirements:
User requirements:
If you are only interested in this simulator, you can download a zip file pc.zip that contains all of the files that you need.
Running in a non-Windows environment:
If you installed the simulator by copying the files from a CD, the
scripts may not have the correct permissions to run. The convert
and runpc files should be executable.
The ASCII files distributed with this distribution are in the Windows format
in which lines end in a carriage return followed by a line feed.
It may be more convenient to have the carriage returns removed.
If you are running under UNIX, Linux, or Mac OSX, it
may be more convenient to have the carriage returns removed.
You can remove all of the carriage returns from these files by executing the
convert script.
If you do a custom installation, you can put the jar files anywhere you want. Modify the runpc.bat (Windows) or runpc (Unix, Linux, Mac OSX) file so that the JARDIR1 or JARDIR2 variables points to the location of the jar files.
If the simulator does not start, make sure you have the Java runtime
executables in your path. In a command window, execute:
java -version
and make sure this displays a version later than 1.0.
Figure 1: The main simulator window.
The top of the screen shows the shared buffer and the shared variables: in, out, n and counter.
Below this are tables containing the producer and consumer code with the number of times the process lost the CPU while executing each instruction, the number of times the instruction was executed, and the number of cycles required by the instruction. Also shown are the values of the register R1, the number of cycles executed and the number of items processed.
This is followed by a collection of buttons for running the simulator, and information about the total number of cycles, the quantum time remaining before the process is removed from the CPU, and the internal consistency state of the simulator.
Lastly, there is a window in which informatory messages are displayed.
There are two types of protocol failure that can be used for stopping conditions. These are controlled by the last of the buttons in the middle column, and are called Internal Inconsistency and External Inconsistency. Internal Inconsistency refers to a problem which occurs when a critical section is interrupted and the shared variables are no longer consistent. For example, the counter may indicate one fewer or one greater number of items in the buffer than are actually there.
External inconsistency refers to having the program process an incorrect item, by consuming an item twice, by skipping an item, or by consuming an item referenced by an uninitialized buffer entry. External inconsistencies are always preceded by at least one internal inconsistency, but it might take a very large number of cycles before an internal inconsistency causes an external inconsistency. It is even possible for an internal inconsistency to correct itself before an external inconsistency occurs.
Initially, the buttons in column 4 are used to control the logging functions before the log file is open or after it is closed. The first button opens the log. When the log file is successfully opened most of the buttons change their function to control the log functions appropriate when logging is in progress.
While the log is closed, the second button toggles between the modes Replace Old Log and Append to Log. In the former case, opening the log file overwrites any file with the same name that already exists. In the latter case, the new log is appended to the old one. The third button can be used to change the name and directory used for storing the log file. Pushing this button pops up a dialog box in which the user can change the directory and log file names. The names of the files for storing the graph image files created by the simulator can also be changed.
The Show Log button can be used to pop up a browser window containing the log file generated. Currently this feature is not supported when the simulator is run locally.
After the log is successfully opened, the Open Log button changes to Close Log, the second button changes to Log Comment, and the third button changes to Stop Log. If there is data to log, the 4th button is Log Current Data.
Close Log terminates logging and closes the log file. Stop Log temporarily stops adding information to the log file but keeps the log file open. When pushed, this button changes to Start Log which resumes the logging.
The Log Comment button pops up a window which allows the user to enter comments into the log file.
An entry is made in the log file whenever the log file is opened or closed or logging is stopped or restarted. A log entry is made whenever a run or multiple runs are started or completed. Statistical information is logged whenever a run completes. Graphs can be displayed using the Draw Graph button in the second column. When a graph is drawn you have the option of inserting it in the log file by pushing the Log button on the graph.
When a single run is done a table is produced similar to the one in Figure 2. For each line of producer or consumer code, the number of times that line was interrupted and executed is given. Interrupted refers to having the process lose the CPU while the program counter points to one of the instructions corresponding to that statement.
At the bottom of the table there are eight pieces of data including the number of cycles executed by the Producer and Consumer, the number of items processed by each, the number of items currently in the shared buffer, the size of the shared buffer, the quantum and the total number of cycles executed.
The last line of the table indicates whether the data is internally consistent, that is if the number of items buffered is the difference between the number produced and the number consumed.
Thu Nov 04 08:52:14 CST 1999 Starting one run until internal failure
Thu Nov 04 08:52:14 CST 1999 Completed
|
|
||||||||||||||||||||||||||||||||||||||||||||||||||||||||||||||||||||||||||||||||||||||||||||||||||||||||
| Items Produced - Items Consumed = 1 != 0 = Number Buffered | |||||||||||||||||||||||||||||||||||||||||||||||||||||||||||||||||||||||||||||||||||||||||||||||||||||||||
Figure 2: A single run, stopping on internal failure.
The result of logging multiple runs is shown in Figure 3.
There are three tables shown. The first one is similar to the one in Figure 2, but the last line gives the average number of cycles executed.
The second table gives statistics about the number of cycles executed. The table shown was from a run which terminated on internal failure. In this case there are 6 lines of data. For each, the total number of cycles is given followed by the number of runs contributing to that total. This is followed by the average, minimum, maximum and standard deviation of the cycles for the runs considered.
The lines in the table correspond to the total number number of cycles, the number of cycles executed by the Producer, the number of cycles executed by the Consumer, the number of cycles until an internal failure, the number of cycles until an internal failure by the Producer, and the number of cycles until an internal failure by the Consumer. Each run will end in one of these types of failures.
The third table summarized the types of failures from the second table. In Figure 3 since the runs terminated when an internal failure occurred, all 10 runs ended in internal failure. Some were from a producer failure and some from a consumer failure. There were no external failures.
|
|
||||||||||||||||||||||||||||||||||||||||||||||||||||||||||||||||||||||||||||||||||||||||||||||||||||||||
| Average Number of Cycles: 6779.40 | |||||||||||||||||||||||||||||||||||||||||||||||||||||||||||||||||||||||||||||||||||||||||||||||||||||||||
| Cycles | Total | Number | Average | Minimum | Maximum | SD |
| Total | 67,794 | 10 | 6,779.40 | 1,397 | 12,410 | 3,937.87 |
| Producer | 34,824 | 10 | 3,482.40 | 806 | 6,259 | 1,956.61 |
| Consumer | 32,970 | 10 | 3,297.00 | 591 | 6,151 | 1,981.47 |
| Internal Failure | 67,794 | 10 | 6,779.40 | 1,397 | 12,410 | 3,937.87 |
| Internal Producer Failure | 31,080 | 3 | 10,360.00 | 7,743 | 12,410 | 1,947.02 |
| Internal Consumer Failure | 36,714 | 7 | 5,244.86 | 1,397 | 10,569 | 3,560.69 |
| Failure | Number | Percentage |
| Internal | 10 | 100.00 |
| Internal in Producer | 3 | 30.00 |
| Internal in Consumer | 7 | 70.00 |
| External | 0 | 0.00 |
| External Skip Item | 0 | 0.00 |
| External Repeat Item | 0 | 0.00 |
Figure 3: Multiple runs, stopping on external failure.
Figure 4 shows the last two tables from a run until an external failure occurred. The first of these has 3 additional lines compared to the corresponding table from Figure 2. These correspond to external failures. An External Repeat Failure indicates that an object was processed twice while an External Skip Failure indicates an item not processed at all by the Consumer.
| Cycles | Total | Number | Average | Minimum | Maximum | SD |
| Total | 952,456 | 10 | 95,245.60 | 3,204 | 217,731 | 73,456.01 |
| Producer | 477,627 | 10 | 47,762.70 | 1,615 | 109,264 | 36,778.64 |
| Consumer | 474,829 | 10 | 47,482.90 | 1,589 | 108,467 | 36,678.13 |
| Internal Failure | 26,848 | 10 | 2,684.80 | 930 | 5,470 | 1,172.59 |
| Internal Producer Failure | 5,432 | 3 | 1,810.67 | 930 | 2,415 | 636.96 |
| Internal Consumer Failure | 21,416 | 7 | 3,059.43 | 1,923 | 5,470 | 1,150.02 |
| External Failure | 952,456 | 10 | 95,245.60 | 3,204 | 217,731 | 73,456.01 |
| External Skip Failure | 372,664 | 3 | 124,221.33 | 76,404 | 217,731 | 66,127.01 |
| External Repeat Failure | 579,792 | 7 | 82,827.43 | 3,204 | 189,911 | 72,939.56 |
| Failure | Number | Percentage |
| Internal | 10 | 100.00 |
| Internal in Producer | 3 | 30.00 |
| Internal in Consumer | 7 | 70.00 |
| External | 10 | 100.00 |
| External Skip Item | 3 | 30.00 |
| External Repeat Item | 7 | 70.00 |
Figure 4: Multiple runs, stopping on external failure.
The next button in the second column shows and allows the user to modify the number of runs performed by the Multiple Runs button.
In the first column, the Quit button will exit the simulator if this is allowed. In some Java implementations, applets are not allowed to terminate themselves and this button does not work.
The Reset button resets the simulator to its initial state. The Fast button, when pushed changes to a Slow button which causes a user-settable delay between cycles so that the user can monitor the progress. Pushing the ! on the right side of this button allows you to change the delay which is measured in milliseconds. Pushing the Slow button changes it back to a Fast button.
The Help button pops up a window giving context-sensitive help. This feature is not yet fully functional.
If the last runs used external inconsistency for termination, you can include information pertaining to the number of cycles until internal inconsistency with the Include Internal Data button which is just above the Draw Graph button.